The Power of Event Attendance Insights in Alumni Networks
In today’s digital age, alumni networks have evolved beyond mere directories into dynamic platforms that foster engagement and opportunities. A crucial component of these modern networks is the use of event attendance insight dashboards. These tools provide valuable data that helps both organizers and participants understand the impact of their involvement.
Alumni professionals and network administrators are increasingly relying on analytics to gauge success metrics, track engagement levels, and refine future events. By leveraging real-time data from these dashboards, stakeholders can make informed decisions that enhance overall member experience and satisfaction within the community.
Understanding Event Attendance Insight Dashboards
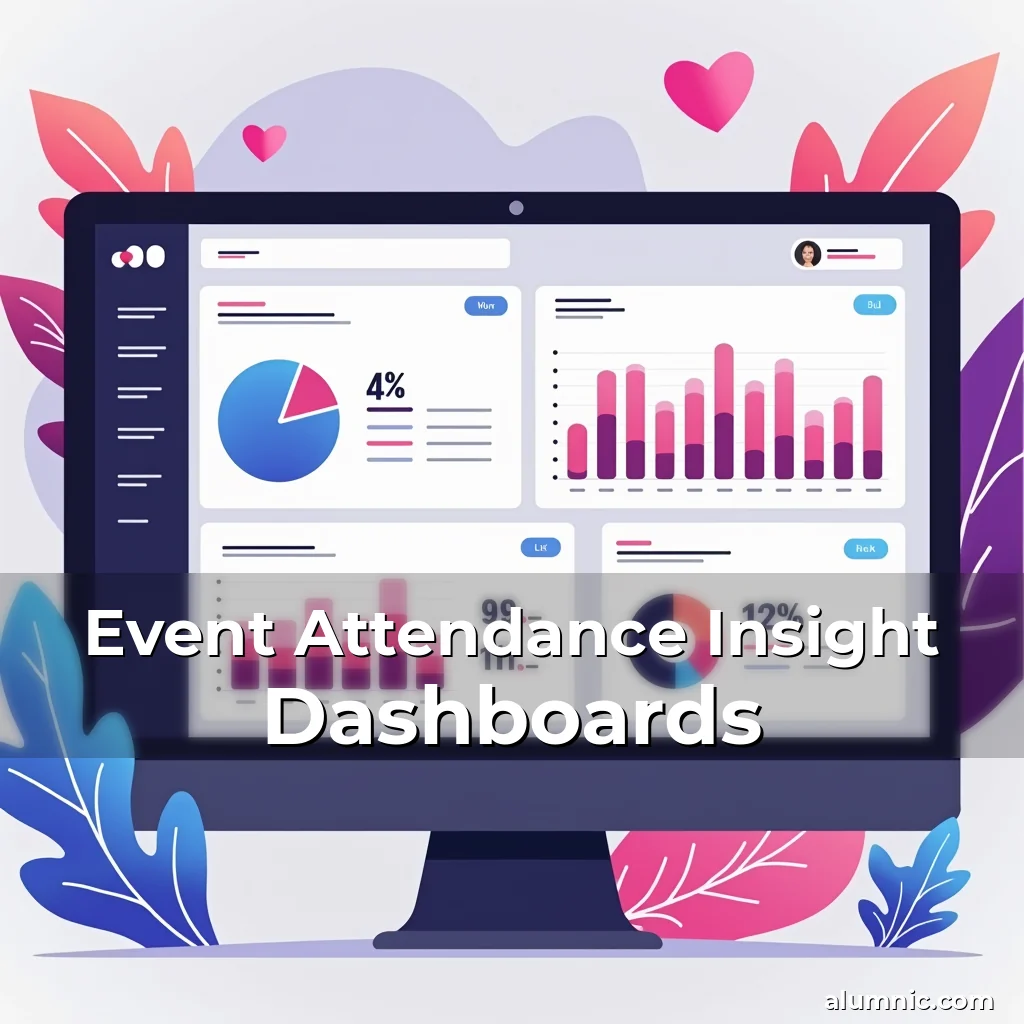
An event attendance insight dashboard serves as a centralized hub where data related to past, present, and potential future events is visualized in an easy-to-understand format. This platform allows users to monitor key performance indicators such as participation rates, demographic breakdowns, and interaction patterns among attendees.
The primary goal of these dashboards is to transform raw data into actionable intelligence. For instance, by analyzing which types of events draw larger crowds or generate higher engagement, organizations can tailor their offerings accordingly. This ensures resources are allocated efficiently while maximizing reach across different segments of the alumni population.
These dashboards often feature customizable filters that enable users to drill down into specific aspects of event data. Whether examining geographic distribution, job roles represented at events, or even time spent during sessions, each filter provides deeper context that aids strategic decision-making processes.
Moreover, integration capabilities allow these dashboards to connect seamlessly with other institutional databases or external platforms used by the alumni association. Such interoperability enhances accuracy and completeness when compiling reports or forecasting trends based on historical information.
- Data Visualization: The ability to represent complex datasets through charts, graphs, and heatmaps makes understanding attendance trends intuitive for all stakeholders involved.
- Real-Time Analytics: Instantaneous updates ensure that any changes made post-event registration reflect accurately on the dashboard without delay.
- User-Friendly Interface: Designed with usability in mind, these interfaces minimize technical barriers so non-experts can navigate them effortlessly.
- Customizable Reports: Users can generate tailored summaries focusing only on relevant KPIs rather than sifting through irrelevant details.
Benefits of Using Event Attendance Insights
One significant benefit of utilizing event attendance insights is improved resource allocation. With clear visibility over which events perform best financially or socially, planners can prioritize those initiatives that yield greater returns.
Additionally, identifying underperforming areas enables timely interventions before they negatively affect future outcomes. This proactive approach helps maintain high standards consistently across various activities organized by the institution.
Fostering stronger connections between current students and alumni becomes easier too; tracking how frequently certain groups attend specific kinds of gatherings reveals natural affinity clusters worth exploring further.
Last but not least, there’s enhanced transparency regarding usage patterns which builds trust amongst members knowing their contributions towards building a vibrant ecosystem aren’t going unnoticed.
How Data Drives Strategic Decisions
Data collected via these dashboards informs numerous strategic choices ranging from venue selection to speaker invitations. When choosing locations for upcoming conferences or workshops, considering factors like travel accessibility versus local footfall predictions offers balanced considerations.
Selecting speakers who align well with attendee interests emerges another area influenced heavily by analytical findings. If surveys indicate strong interest in entrepreneurship topics then scheduling experts known for inspiring talks could significantly boost turnout figures.
Furthermore, managing session timings effectively requires careful examination of what timeslots receive most attention historically speaking. Adjustments here may lead towards increased attendance percentages overall.
This methodical reliance upon empirical evidence rather than guesswork transforms traditional planning methods into something much more precise and effective.
Engagement Strategies Enhanced Through Insights
By monitoring how individuals interact with different elements within an event setting—like breakout rooms versus keynote addresses—the nature of engagement strategies can be fine-tuned accordingly. Identifying popular discussion points empowers facilitators to create more targeted follow-ups after meetings conclude.
Personalization efforts also gain momentum once behavioral tendencies become apparent through repeated observations. Tailoring communications around preferred modes of communication increases chances of successful outreach campaigns directed specifically toward identified audiences.
Lastly, recognizing commonalities shared among active participants leads naturally into forming specialized committees focused entirely on nurturing particular subsets within broader alumni circles thereby enhancing cohesion through focused interactions.
Measuring Impact Beyond Numbers
While quantitative measures remain essential components of evaluation frameworks, qualitative feedback gathered alongside numerical data adds depth necessary for holistic assessments. Surveys conducted immediately following events capture sentiments expressed firsthand providing invaluable input seldom captured purely numerically.
Longitudinal studies tracking individual growth trajectories post-participation reveal nuanced effects resulting from sustained involvement compared against sporadic attendance records alone.
Cross-referencing social media mentions generated pre-and-post-events highlights influence exerted beyond immediate settings influencing wider public discourse surrounding respective subjects covered therein.
Case Studies Illustrating Success Metrics
A case study involving XYZ University showcases how implementing advanced analytics led to notable improvements in event management effectiveness. Before adopting new software solutions, organizing committee faced challenges relating primarily to predicting accurate headcounts leading sometimes disastrous logistical oversights.
Post-adoption scenarios revealed marked differences including better prediction models enabling optimal seating arrangements reducing waste associated with inadequate space provisions. Also observed was heightened participant satisfaction scores attributed largely due to smoother operations experienced throughout duration of proceedings.
Detailed analysis showed correlation existing between frequency of attendance and subsequent employment placements reported later years indicating long term benefits arising simply from consistent exposure facilitated through regular meetups arranged strategically using previously unknown correlations discovered initially through big data mining techniques applied retrospectively now becoming standard practice moving forward.
Evolving Trends Within Dashboard Technologies
As technology continues advancing rapidly, innovations within dashboard design constantly emerge offering novel approaches aimed at making interpretation simpler yet richer simultaneously. Integration with AI powered predictive modeling algorithms stands out currently as particularly transformative addition.
Predictive analytics capabilities grant administrators foresight allowing preemptive actions addressing anticipated issues before they manifest physically affecting actual events themselves. This includes everything from anticipating weather disruptions potentially impacting outdoor functions up until last minute cancellations necessitating quick alternative plans elsewhere.
Virtual reality overlays combined with physical spaces introduce immersive experiences where visitors can explore multiple venues virtually prior committing themselves fully ensuring expectations aligned closely with realities awaiting them onsite.
Mobile applications now support offline access meaning even amidst connectivity challenges individuals retain full functionality thereby broadening reach especially amongst younger demographics less inclined traditionally towards conventional networking avenues available solely online nowadays being perceived differently altogether.
Conclusion
Event attendance insight dashboards offer immense value to alumni networks seeking ways to optimize their operations while fostering meaningful relationships among constituents. Through thoughtful implementation supported by robust technological infrastructure, institutions lay solid foundations capable sustaining continuous improvement cycles benefiting everyone involved.
To harness this power effectively requires commitment spanning organizational culture shifts embracing data driven cultures actively promoting transparency sharing regularly updated progress reports highlighting achievements attained thus far along journey embarking upon utilizing these powerful analytic tools transforming passive observers into proactive contributors shaping destiny collectively achieved together.
news is a contributor at Alumnic.com. We are committed to providing well-researched, accurate, and valuable content to our readers.